Images
The Images tab lists every image file found in the configured image directory. If a single image was opened using the Open button all the other images from the directory this image is placed in are also displayed there.
Image List
Section titled “Image List”All discovered images are shown in a table. Use the search field at the top to filter by filename.
Click any row to:
- Load the image in the viewport for preview.
- Display image metadata in the meta panel below - dimensions, pixel size, number of channels, Z planes, and time frames.
The selected image is also the one used as the live preview source when editing pipeline parameters.
Image Meta Panel
Section titled “Image Meta Panel”Selecting an image fills the Image Meta panel with detailed meta information about the image.
| Section | Fields |
|---|---|
| Acquisition | Magnification, Channels · Z · T, Bit depth |
| Channels | Per-channel name and emission wavelength (nm) |
| Dimensions | Width × Height, storage size |
| Calibration | Pixel X / Y / Z size (nm) - editable via Edit / Done / Reset |
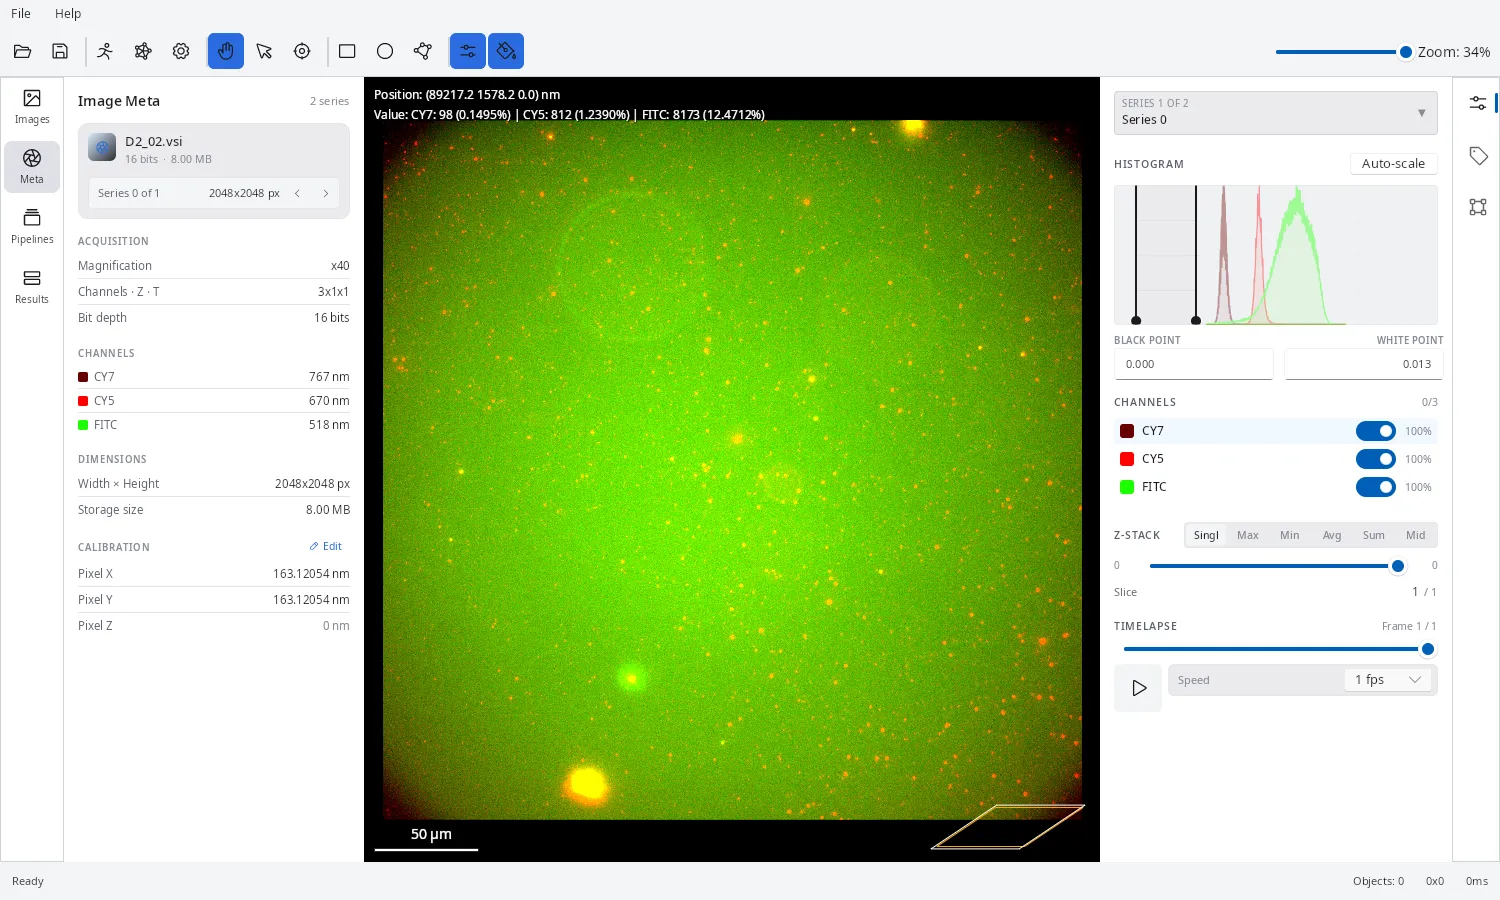
Use the Calibration section to correct pixel size if it was not embedded correctly in the source file - this affects the scale bar and all physical-unit measurements (area, distance) calculated during analysis.
Image Viewer
Section titled “Image Viewer”The viewer panel shows the selected image with the following controls:
Channel controls
Section titled “Channel controls”For multi-channel images, each channel can be independently configured:
- Visibility toggle - show or hide a channel in the composite view.
- Colour assignment - map a greyscale channel to a display colour (e.g. blue for DAPI, red for Cy5).
- Brightness / contrast - per-channel min/max input range.
- Auto-adjust - automatically set min/max from the image histogram.
Z-stack navigation
Section titled “Z-stack navigation”When an image has multiple Z planes:
- Use the Z-plane slider to step through individual planes.
- Switch between projection modes (Max, Min, Avg, Sum, Middle) in the toolbar.
T-stack playback
Section titled “T-stack playback”When an image has multiple time frames:
- Click Play in the toolbar to animate the sequence.
- Set the playback speed in frames per second.
Scale bar
Section titled “Scale bar”A physical scale bar is overlaid on the image. The units are nm, µm or mm based on the actual zoom level. Pixel sizes are read from the image metadata.
If the image does not contain pixel size information use the Calibration section to define it manually.
Navigator minimap
Section titled “Navigator minimap”For large images, a thumbnail minimap in the corner shows the full image with the current viewport highlighted.
Position and pixel value readout
Section titled “Position and pixel value readout”As you move the mouse over the viewport, a HUD overlay in the top-left corner shows the cursor’s position (in physical units, using the calibrated pixel size) and the pixel value for every visible channel.
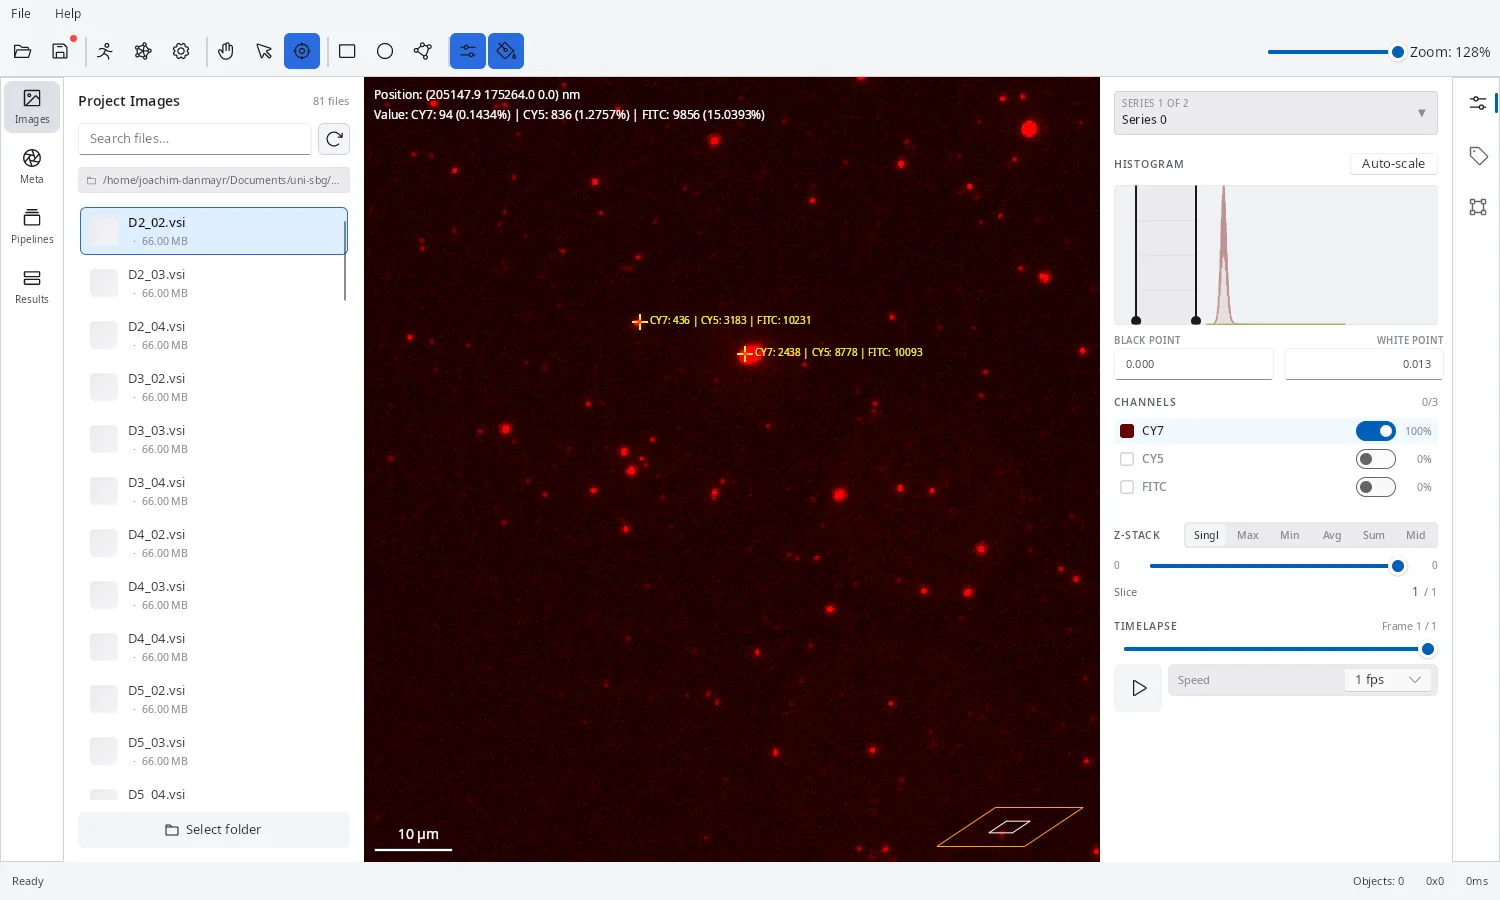
This is a live readout that updates continuously with mouse movement - it does not place a persistent measurement marker.
To place a persistent measurement use the cross fade button from the toolbar and click on the wanted position in the image. A permanent marker with the intensity values of all image channels is displayed. Right click on the permanent marker to remove it.
ROI Annotation
Section titled “ROI Annotation”Draw manual regions of interest directly on the image:
- Rectangle - drag to define a rectangular ROI.
- Oval - drag to define an oval/elliptical ROI.
- Polygon - click to place vertices, double-click to close.
Annotations are saved per-image to the project file and are preserved across sessions.
Series Selection
Section titled “Series Selection”Some image formats (e.g. LIF, CZI) store multiple image series in a single file. Select the desired series index in the properties panel to analyze a specific sub-image.
Supported Formats
Section titled “Supported Formats”See Image Formats for the full list of supported file types.