Threshold
The Threshold command is the primary segmentation step. It converts a greyscale image to a binary mask: pixels with intensity below the minimum threshold become 0 (background); pixels above become 65535 (foreground).
The output of Threshold feeds directly into Connected Components.
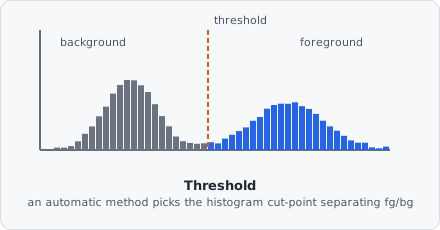
Single threshold
Section titled “Single threshold”Define one threshold entry to produce a simple binary mask:
| Parameter | Description |
|---|---|
| Method | Manual or one of the auto-threshold algorithms |
| Min threshold | Minimum intensity to include as foreground |
| Max threshold | Maximum intensity to include as foreground (set to 65535 to disable) |
| Unit | Intensity unit (Absolute 0–65535, Percent 0–100, or Relative 0–1) |
| Object class | The segmentation class assigned to objects detected by this threshold entry |
Multiple threshold classes
Section titled “Multiple threshold classes”Click + Add to define additional threshold entries for the same image. Each entry uses a different intensity range and assigns a different segmentation class, allowing two or more object populations to be detected from one image in a single step.
Under the hood, each threshold class maps to a distinct greyscale value in the binary output (65535 for the first class, decrementing for subsequent classes). Connected Components and Extract ROIs use these values to distinguish the populations.
Auto-threshold algorithms
Section titled “Auto-threshold algorithms”When Method is not Manual, EVAnalyzer analyses the image histogram and computes a threshold automatically, following the same set of methods popularized by ImageJ’s Auto Threshold plugin. Each one makes a different assumption about what separates foreground from background, so the “best” method depends on the shape of your histogram:
| Method | Assumption | Reference |
|---|---|---|
| Otsu | Maximizes between-class variance (the most widely used general-purpose method) | Otsu, “A Threshold Selection Method from Gray-Level Histograms,” IEEE Trans. SMC, vol. 9, no. 1, pp. 62-66, 1979 |
| Li | Minimizes cross-entropy between the image and its thresholded version | Li & Lee, “Minimum Cross Entropy Thresholding,” Pattern Recognition, vol. 26, no. 4, pp. 617-625, 1993 |
| MinError | Iteratively fits two Gaussians and minimizes classification error | Kittler & Illingworth, “Minimum Error Thresholding,” Pattern Recognition, vol. 19, no. 1, pp. 41-47, 1986 |
| Triangle | Geometric: line from the histogram peak to its tail, threshold at max distance | Zack, Rogers & Latt, “Automatic Measurement of Sister Chromatid Exchange Frequency,” J. Histochem. Cytochem., vol. 25, no. 7, pp. 741-753, 1977 |
| Moments | Preserves the first three moments of the original histogram | Tsai, “Moment-Preserving Thresholding: A New Approach,” Computer Vision, Graphics, and Image Processing, vol. 29, no. 3, pp. 377-393, 1985 |
| Huang | Minimizes a fuzzy-set measure of image “fuzziness” | Huang & Wang, “Image Thresholding by Minimizing the Measures of Fuzziness,” Pattern Recognition, vol. 28, no. 1, pp. 41-51, 1995 |
| Intermodes | Assumes a bimodal histogram; smooths until only two peaks remain, cuts between them | Prewitt & Mendelsohn, “The Analysis of Cell Images,” Annals of the New York Academy of Sciences, vol. 128, no. 3, pp. 1035-1053, 1966 |
| IsoData | Iterative clustering around the mean of two classes | Ridler & Calvard, “Picture Thresholding Using an Iterative Selection Method,” IEEE Trans. SMC, vol. 8, no. 8, pp. 630-632, 1978 |
| MaxEntropy | Maximizes the combined Shannon entropy of foreground and background | Kapur, Sahoo & Wong, “A New Method for Gray-Level Picture Thresholding Using the Entropy of the Histogram,” Computer Vision, Graphics, and Image Processing, vol. 29, no. 3, pp. 273-285, 1985 |
| Mean | The average intensity of all pixels | - |
| Minimum | Smooths the histogram until it is bimodal, cuts at the valley between peaks | - |
| Percentile | Assumes a fixed fraction of pixels is foreground | Doyle, “Operations Useful for Similarity-Invariant Pattern Recognition,” J. ACM, vol. 9, no. 2, pp. 259-267, 1962 |
| RenyiEntropy | A generalization of MaxEntropy using Rényi entropy | Sahoo, Wong & Chen, “Threshold Selection Using Rényi’s Entropy,” Pattern Recognition, vol. 30, no. 1, pp. 71-84, 1997 |
| Shanbhag | An information-theoretic extension of Kapur’s method | Shanbhag, “Utilization of Information Measure as a Means for Image Thresholding,” CVGIP: Graphical Models and Image Processing, vol. 56, no. 5, pp. 414-419, 1994 |
| Yen | Maximizes a entropic correlation criterion between classes | Yen, Chang & Chang, “A New Criterion for Automatic Multilevel Thresholding,” IEEE Trans. Image Processing, vol. 4, no. 3, pp. 370-378, 1995 |
Auto-thresholds can fail on empty images (no objects, only noise) because they always find a separation. Prevent this by setting a non-zero Min threshold as a lower bound: if the computed value falls below it, EVAnalyzer uses the minimum instead.
Maximum threshold
Section titled “Maximum threshold”Setting Max threshold to a value below 65535 restricts detection to pixels within the [min, max] range. This allows extraction of a specific intensity band - for example to separate bright artefacts from dim objects, or to extract the background itself by setting Min to 0 and Max to just below the signal level.