Pipelines
Pipelines define the sequence of image processing commands applied to raw inputs to extract specific Regions of Interest (ROIs). EVAnalyzer supports multiple, independent pipelines within a single project. Each pipeline can isolate and process a distinct image channel, or target pre-existing parent ROIs. Because a pipeline can ingest and refine ROIs generated by a previous workflow step, users can easily construct complex, multi-channel processing architectures to resolve sophisticated biological queries.
Creating a Pipeline
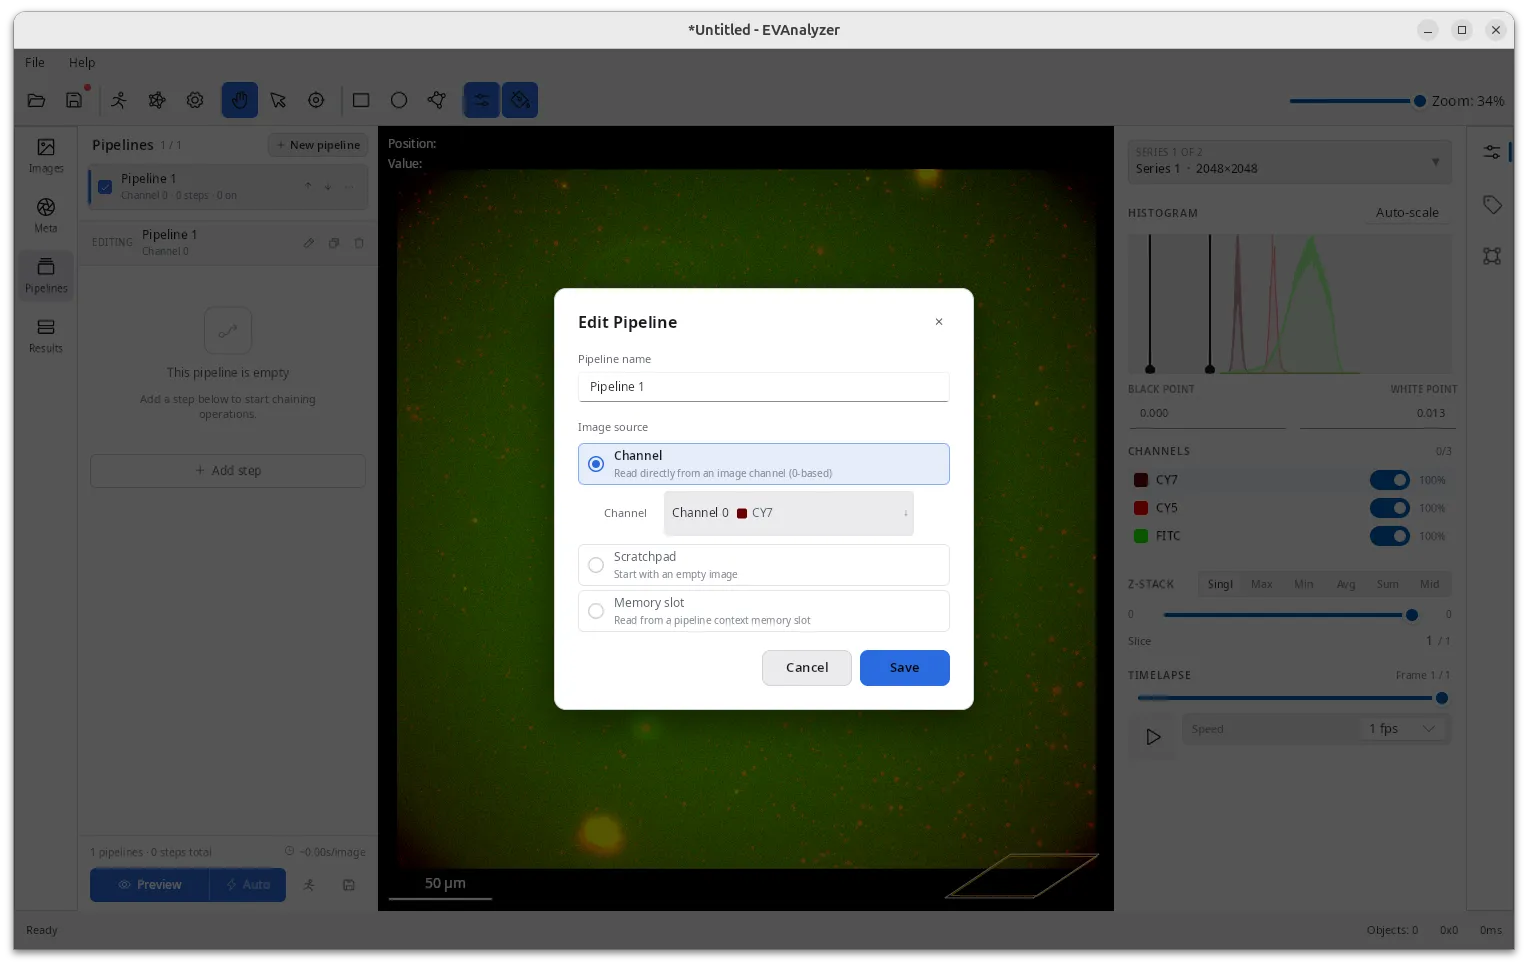
Section titled “Creating a Pipeline”In the Pipelines tab, click:
- New pipeline - start with an empty pipeline.
- The arrow beside New pipeline - choose a preset template to load a pre-configured set of steps.
Available presets include:
- EV channel - optimised for extracellular vesicle quantification in single-vesicle imaging with low background.
- Cell brightfield - optimised for cell segmentation in brightfield images.
- Nucleus - optimised for nucleus segmentation from fluorescent labelling (Hoechst, DAPI).
- EV in cell - optimised for EV quantification inside cells.
Pipeline Editor
Section titled “Pipeline Editor”Click a pipeline name to open the pipeline editor.
+### Pipeline steps
Steps are listed top-to-bottom and executed in that order.
Click + Add step (the - + - button) to open the command picker, which shows only commands compatible with the current pipeline state.
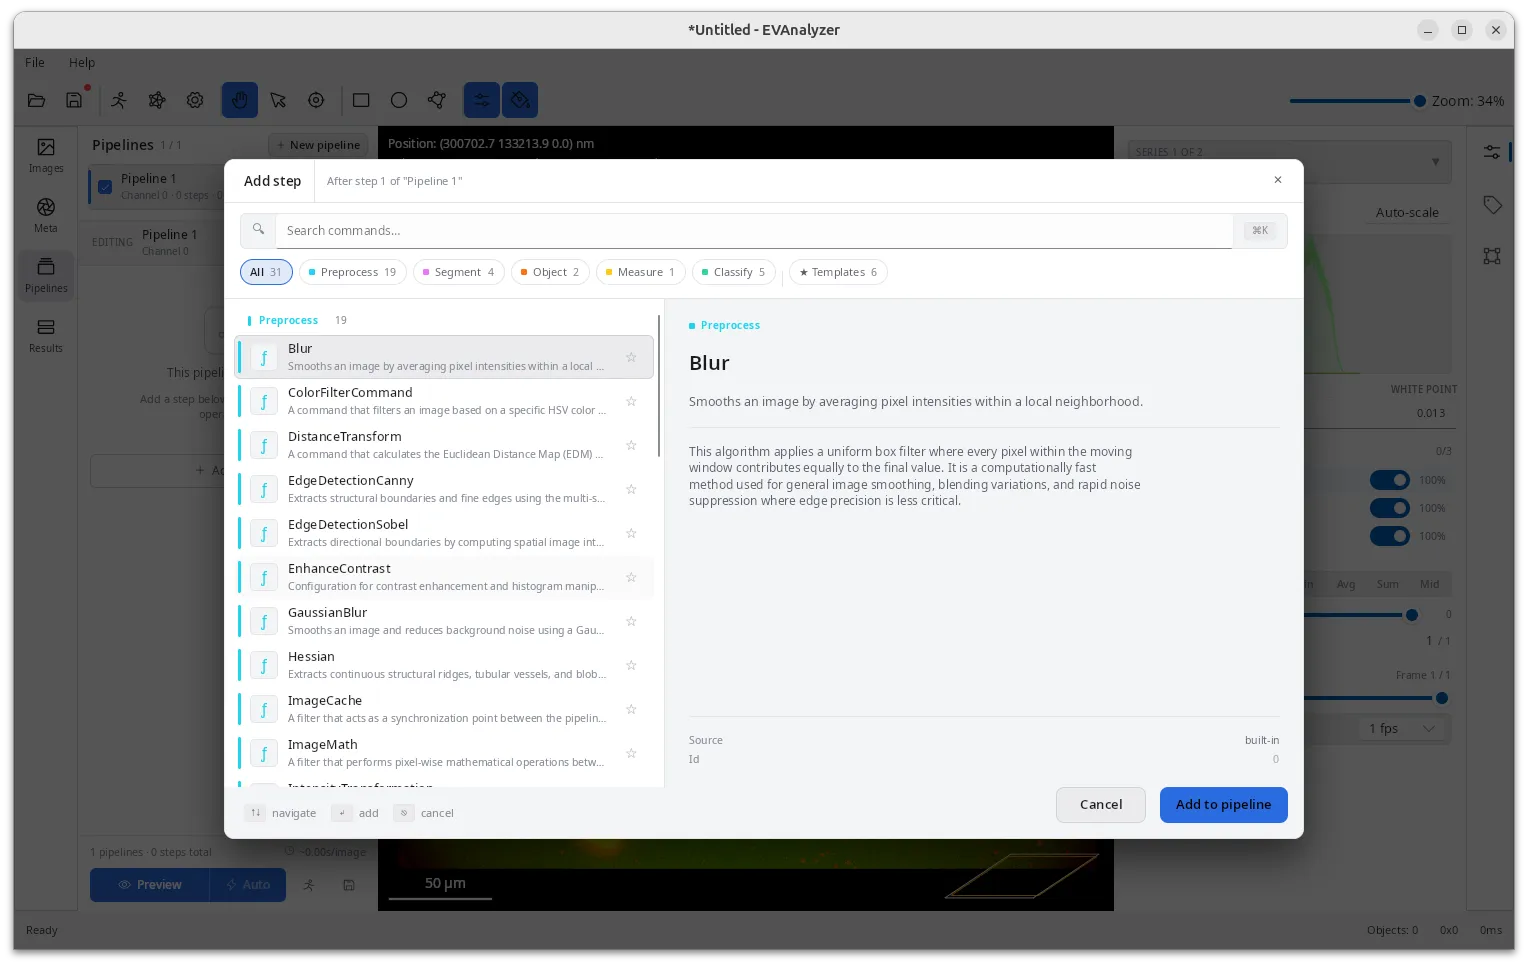
Commands fall into categories indicated by colour:
- Cyan - image processing (input: image, output: image) e.g. Smoothing, Edge detection, …
- Rosa - segmentation (input: image, output: segmentation mask) e.g. Threshold, AI UNet, …
- Orange - object operations (input: segmentation mask, output: objects) e.g. Connected components, Watershed, …
- Yellow - measurement (input: objects, output: region of interests)
- Green - classify (input: region of interests, output: region of interests)
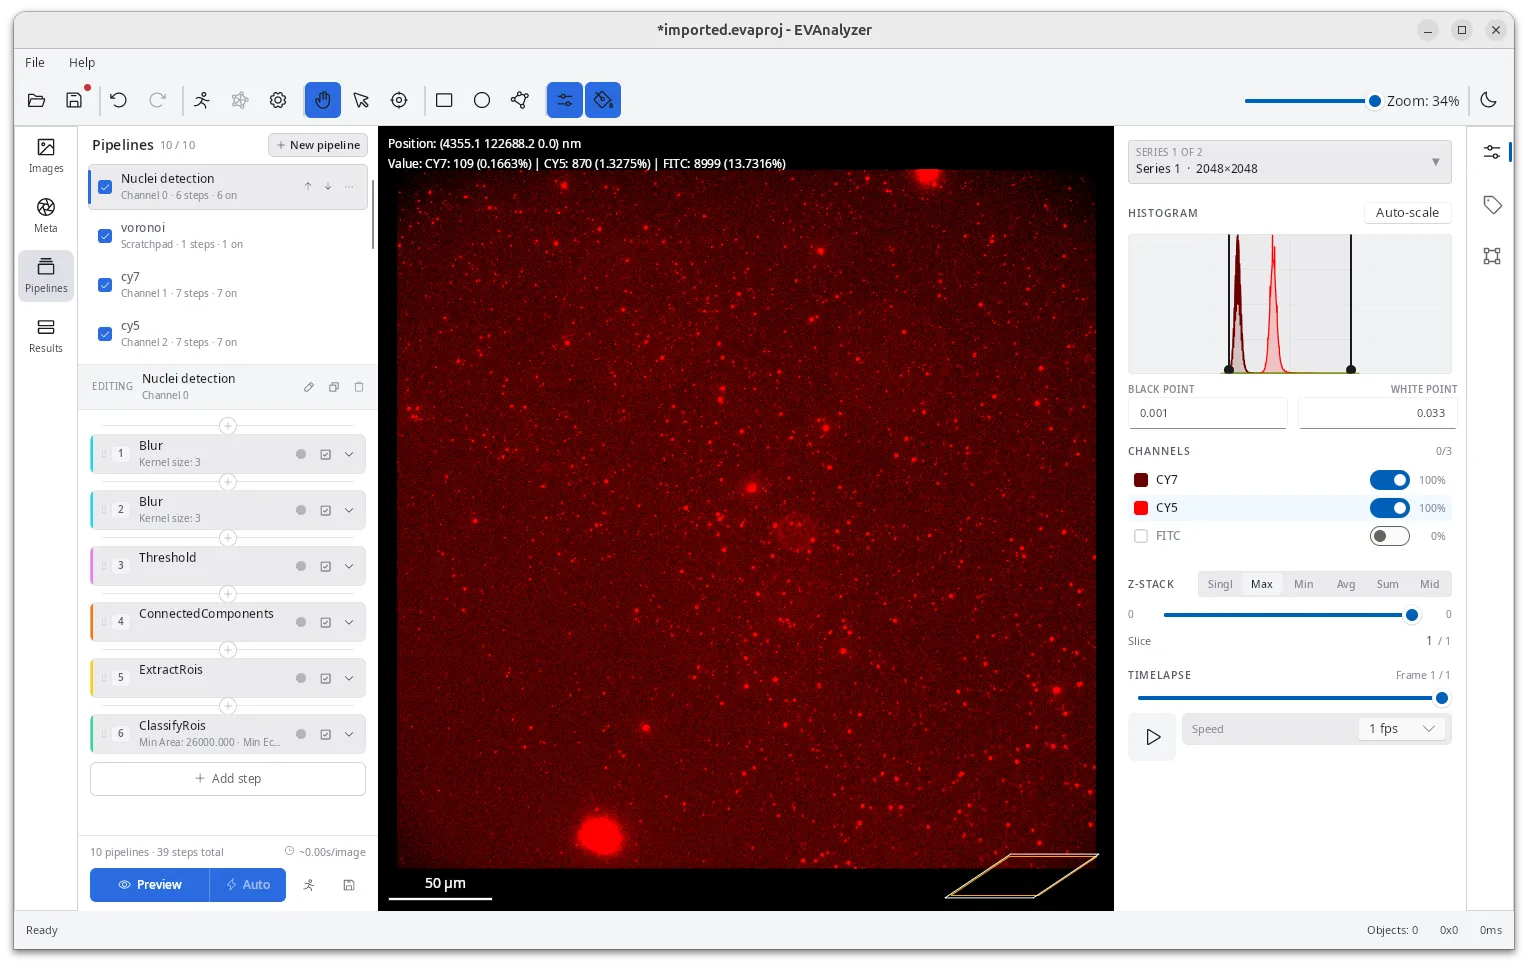
A typical pipeline flow:
- Image processing commands reduce noise and enhance the signal (Rolling Ball, Gaussian Blur, …).
- Segmentation commands separate foreground from background (Threshold → Connected Components → Watershed).
- Extract ROIs converts the binary mask into a set of segmentation-class objects.
- Classify ROIs applies size/circularity filters and assigns an object class.
- Object processing commands perform further analysis (Colocalization, Distance Transform, …).
Pipeline templates
Section titled “Pipeline templates”The command selection dialog also provides a Template section. This section contain predefined command sequences which can be used inside your pipeline. By selecting a template the template commands are added in defined order at your selected position.
Live preview
Section titled “Live preview”The viewport on the right shows the result of all pipeline steps applied to the currently selected image. Changing any parameter immediately updates the preview. A live object count is shown in the legend.
Use the zoom controls to inspect segmentation quality, and the side-by-side button to compare the original and processed image simultaneously.
Saving a Pipeline as a Template
Section titled “Saving a Pipeline as a Template”Click the Save button at the button of the pipelines panel, to store the current pipeline (all steps and parameters) for reuse in other projects.
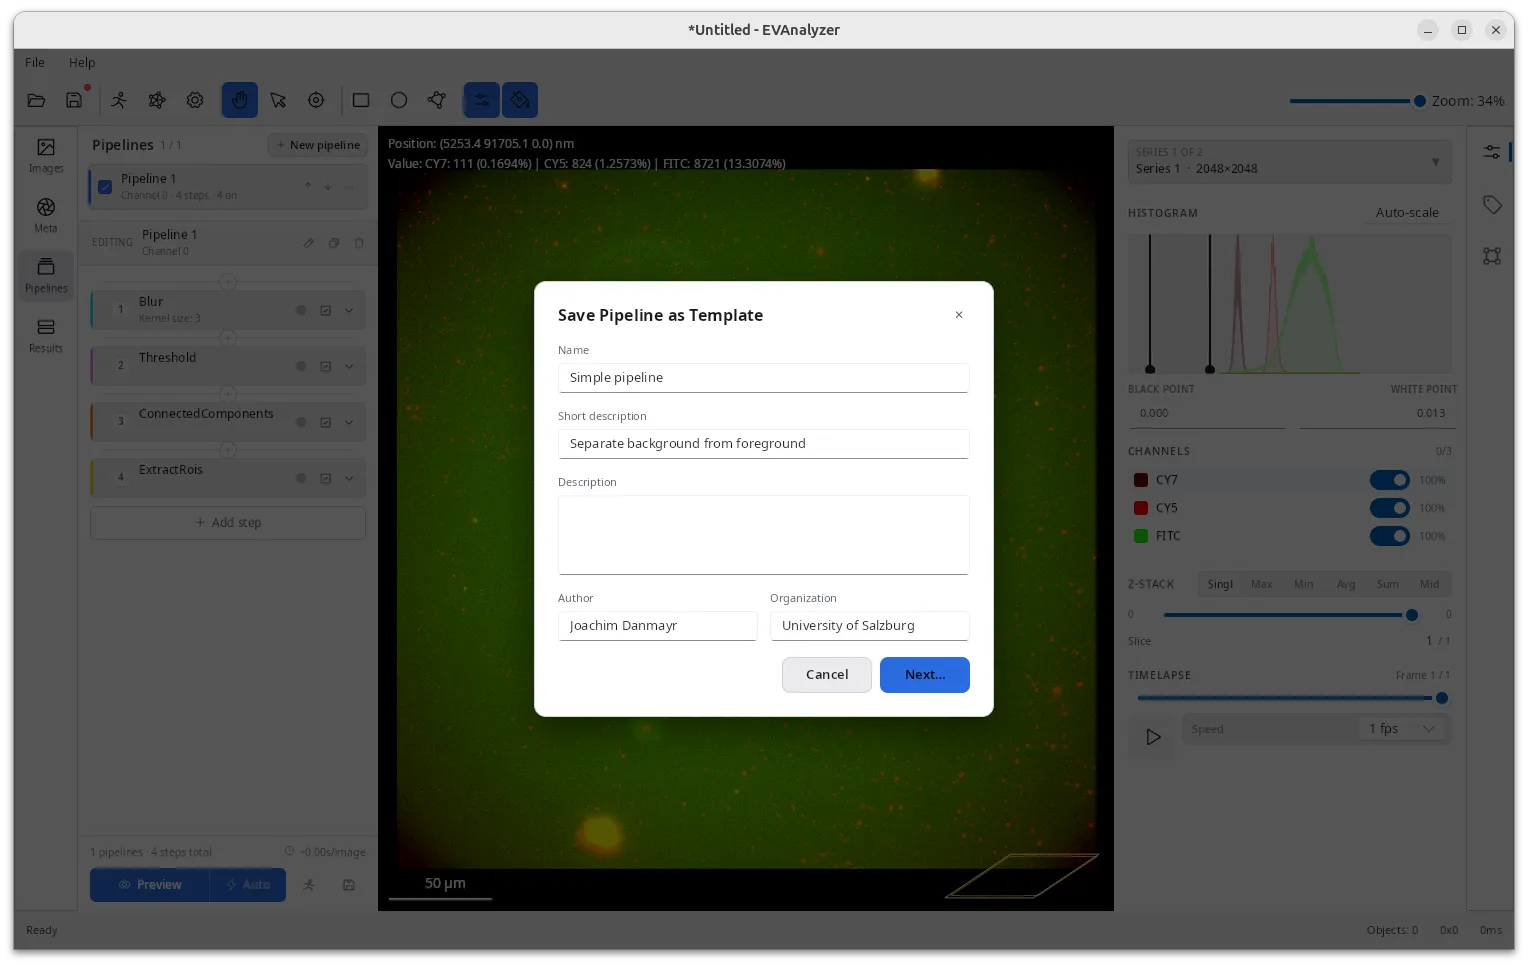
Fill in Name, Short description, Description, Author, and Organization, then click Next… to choose a save location in the native file dialog. Pipeline templates use the .evapipe extension.
Templates saved to the default location (~/evanalyzer/templates/) automatically appear in the preset drop-down next to New pipeline the next time you create a pipeline, alongside the built-in presets (EV channel, Cell brightfield, Nucleus, EV in cell).
Saving a Project as a Template
Section titled “Saving a Project as a Template”In addition to saving individual pipelines, you can save an entire project — including its class definitions, plate configuration, and all pipelines — as a project template.
Click Save as Template in the File menu to open the template dialog.
Fill in Name, Short description, Description, Author, and Organization, then choose a save location.
Project templates use the .evapt extension.
To create a new project from a template, click open the File menu and select New from Template. This pre-populates the class editor, plate settings, and all pipelines, so you can start a new experiment with a known-good configuration without rebuilding from scratch.
Running the Analysis
Section titled “Running the Analysis”Once all pipelines are configured, click Run in the toolbar to start the analysis.
- A progress dialog shows per-image and per-pipeline progress.
- Click Stop to interrupt; in-progress tasks will finish before halting.
- Click Open results folder to locate the output files immediately.
Results are written to:
<image_directory>/evanalyzer/<job_name>/results.evadbBest Practices
Section titled “Best Practices”- Add one pipeline per image channel you want to analyze.
- Add separate pipelines for object-processing steps (colocalization, in-cell counting) that operate on already-extracted objects.