First Steps
This guide walks you through the essential workflow: open a set of images, configure object classes and pipelines, run the analysis, and inspect the results.
1. Open EVAnalyzer
Section titled “1. Open EVAnalyzer”Start EVAnalyzer as described in Installation. The application opens showing the project configuration panel on the left, an empty image viewport in the middle and the image control panel to the right.
2. Set Up Your Project
Section titled “2. Set Up Your Project”The navigation panels contain four tabs that must be configured in order to set up a project properly.:
Images → Classification → Pipelines → Results.
Images tab
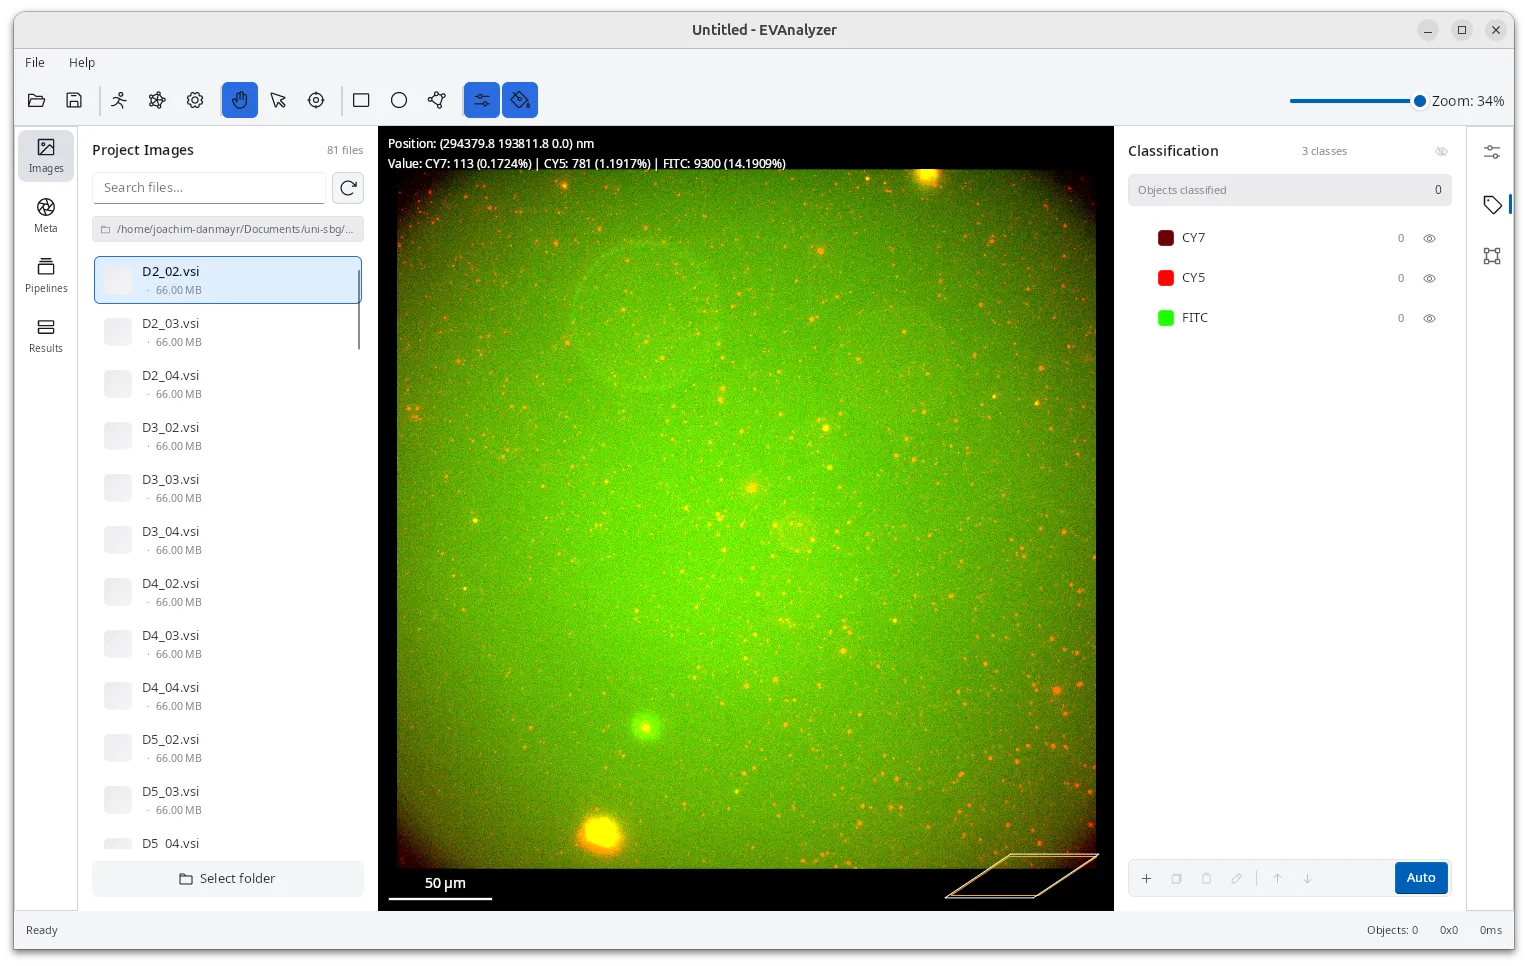
Section titled “Images tab”Use the Select folder button to select the folder where the images to analyze are stored in.
Once the directory is set, EVAnalyzer lists all found image files. Click an image to preview it and inspect its metadata (channels, pixel sizes, Z/T dimensions).
Classification tab
Section titled “Classification tab”Before building pipelines, define the object classes you want to detect - for example, CY7, CY5, DAPI.
The classification tab is the second tab in the right side panel.
- Click the + button to add a class.
- Assign a name and a display color.
Pipelines tab
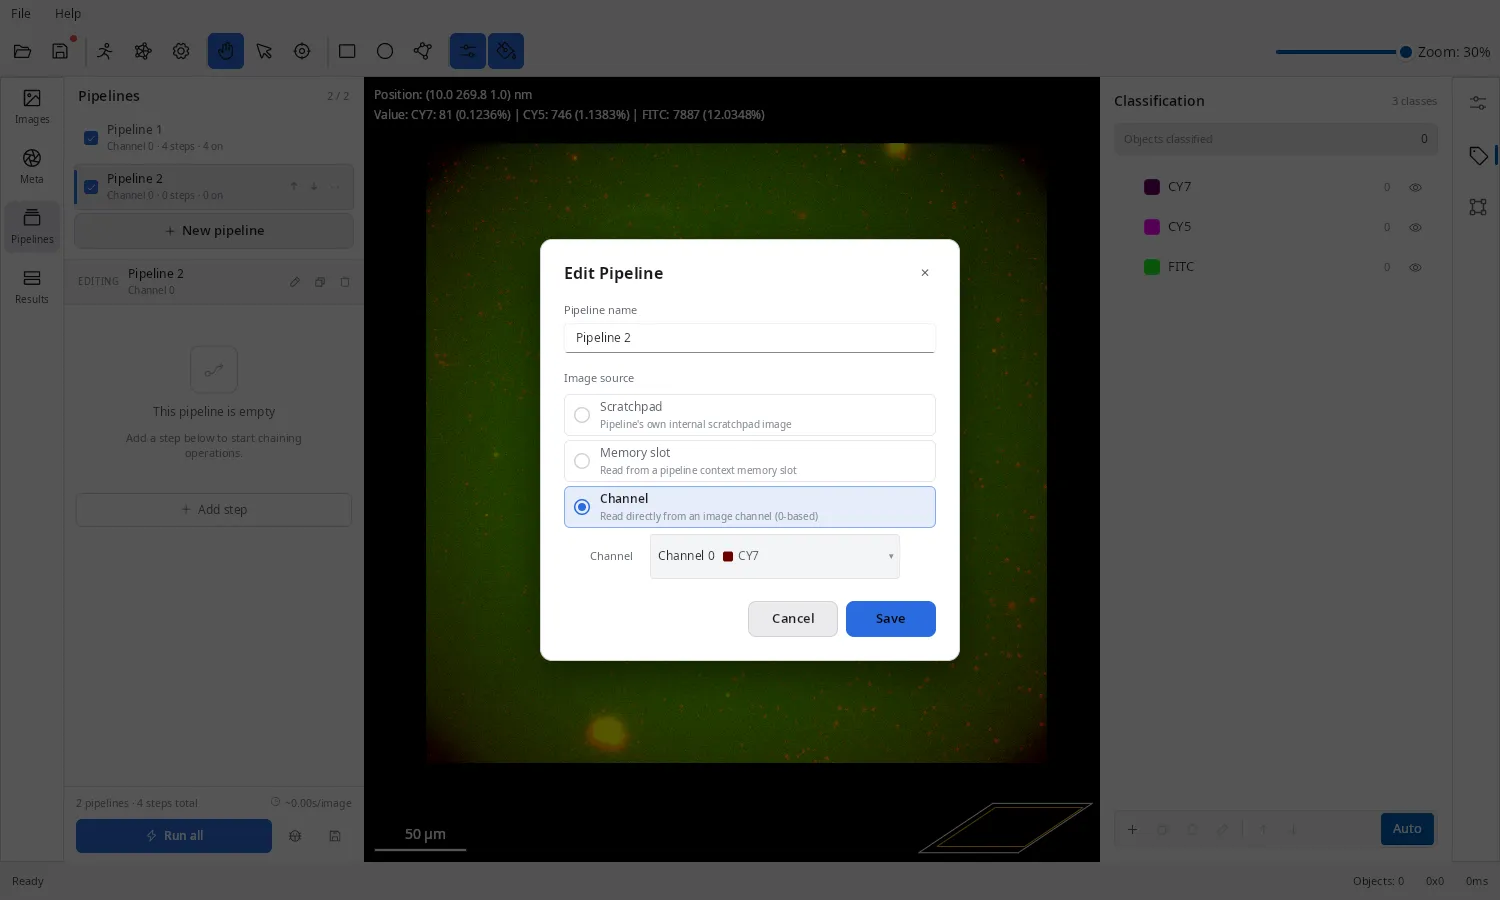
Section titled “Pipelines tab”Pipelines extract objects from image channels. Click New pipeline which opens the pipeline edit dialog. Enter a pipeline name and select the image source the pipeline should start.
- Channel - the default value is to start with a specific image channel the pipeline should work on.
- Scratchpad - starts with an empty image, this option is used if the pipeline should work on already extracted objects
- Memory slot - images can be stored to a temporary memory using the
ImageCachecommand, start with an image from this cache
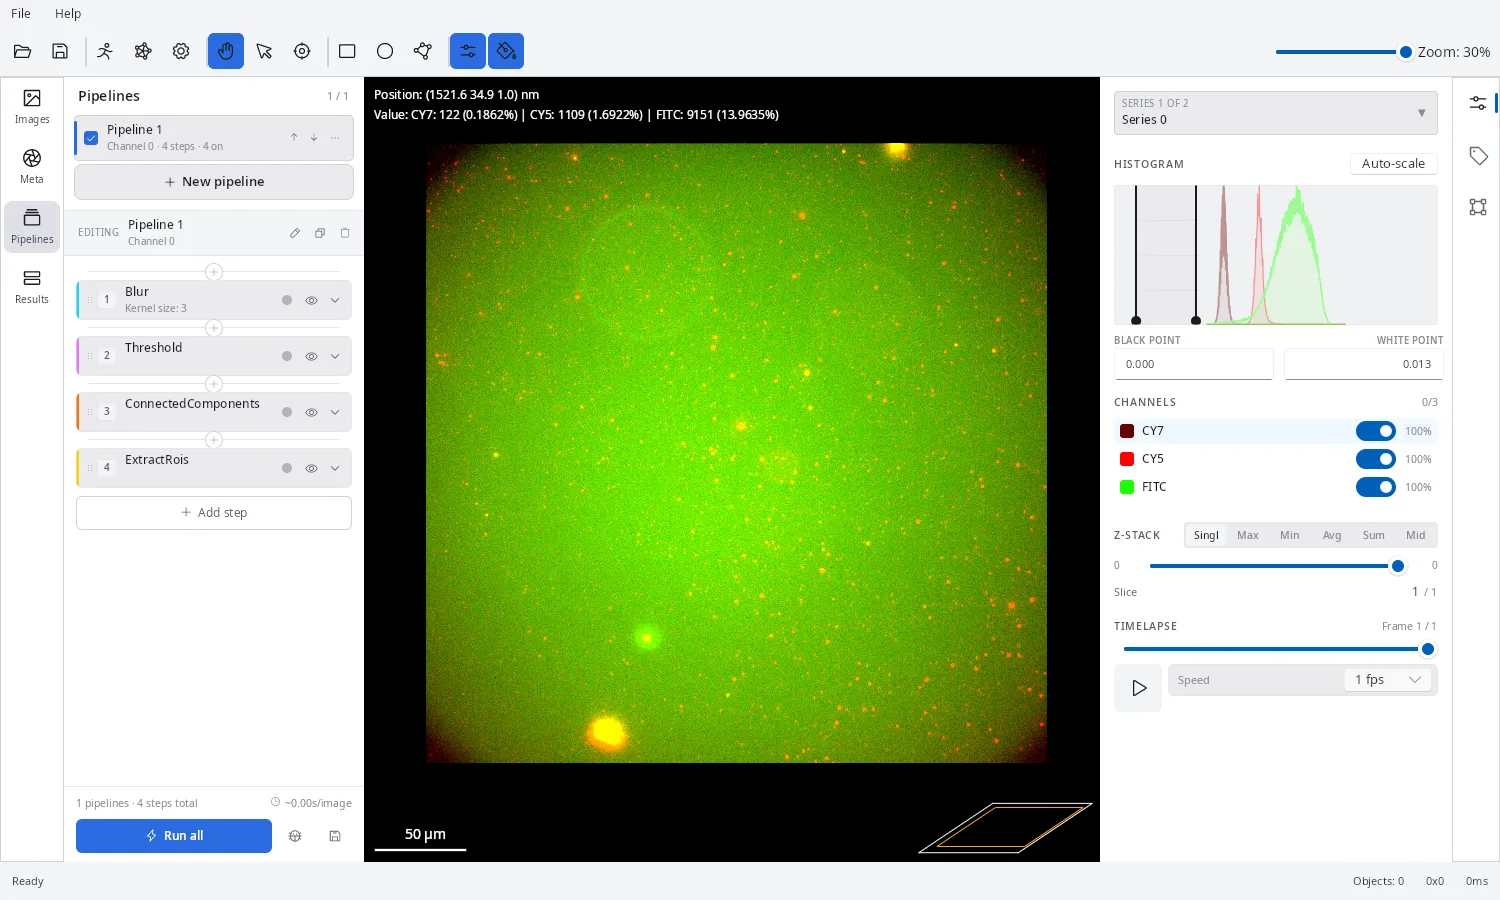
Now the + Add step and + buttons can be used to add pipeline steps. The order is always Preprocessing → Segmentation → Object detection → Object extraction
A minimal spot-detection pipeline looks like:
- Rolling Ball - remove uneven background
- Gaussian Blur - reduce noise
- Threshold - convert greyscale to binary
- Connected Components - label each foreground region
- Watershed - split touching objects
- Extract ROIs - create region of interest objects to work on
- Classify ROIs - filter by size/circularity and assign an object class
Before the preview can be shown or the analysis can be started, the project must be saved using the Save button in the toolbar.
To update the live preview in the middle press the Preview button at bottom. Using the Auto button enables auto preview, which automatically refreshes the preview if any parameter has been changed.
3. Run the Analysis
Section titled “3. Run the Analysis”Click the Run button in the pipelines panel or the Run in the toolbar.
A run dialog appears which allows to set a custom job name under which the result is stored. If no job name is specified, EVAnalyzer will generate a random name for this job.
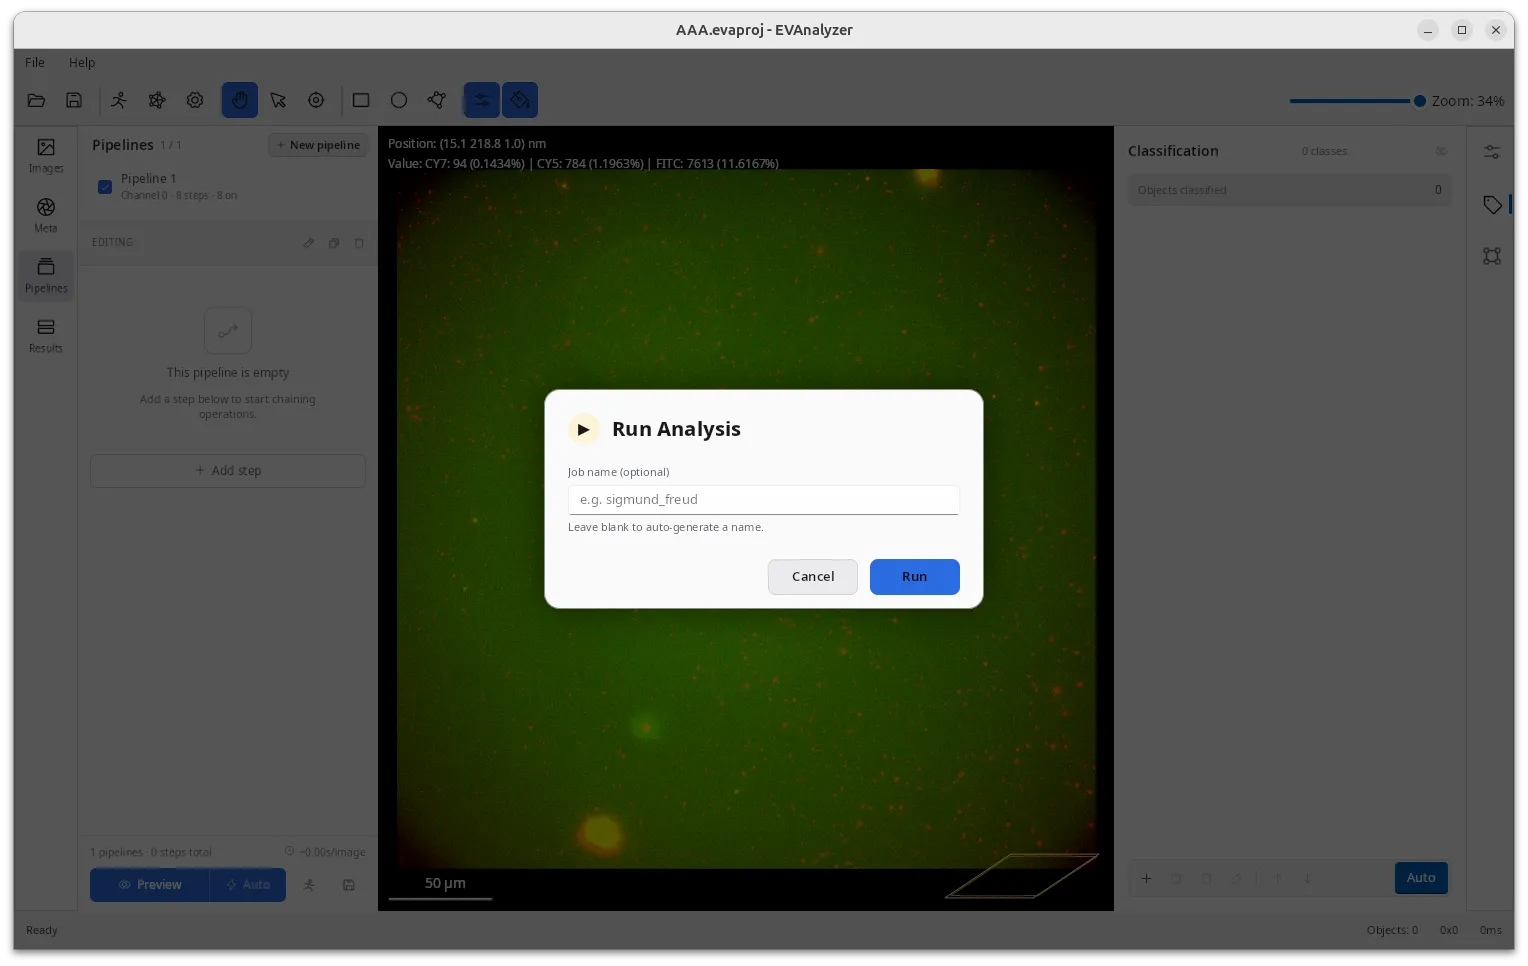
Once Run is pressed a progress dialog appears.
When complete, switch to the Results tab to open the results of the analysis.
Results are saved to:
<image_directory>/evanalyzer/<job_name>/results.evadb4. View Results
Section titled “4. View Results”Switch to the Results tab. EVAnalyzer scans the evanalyzer/ subfolder inside your image directory and lists every results.evadb file it finds. Click any entry to open it.
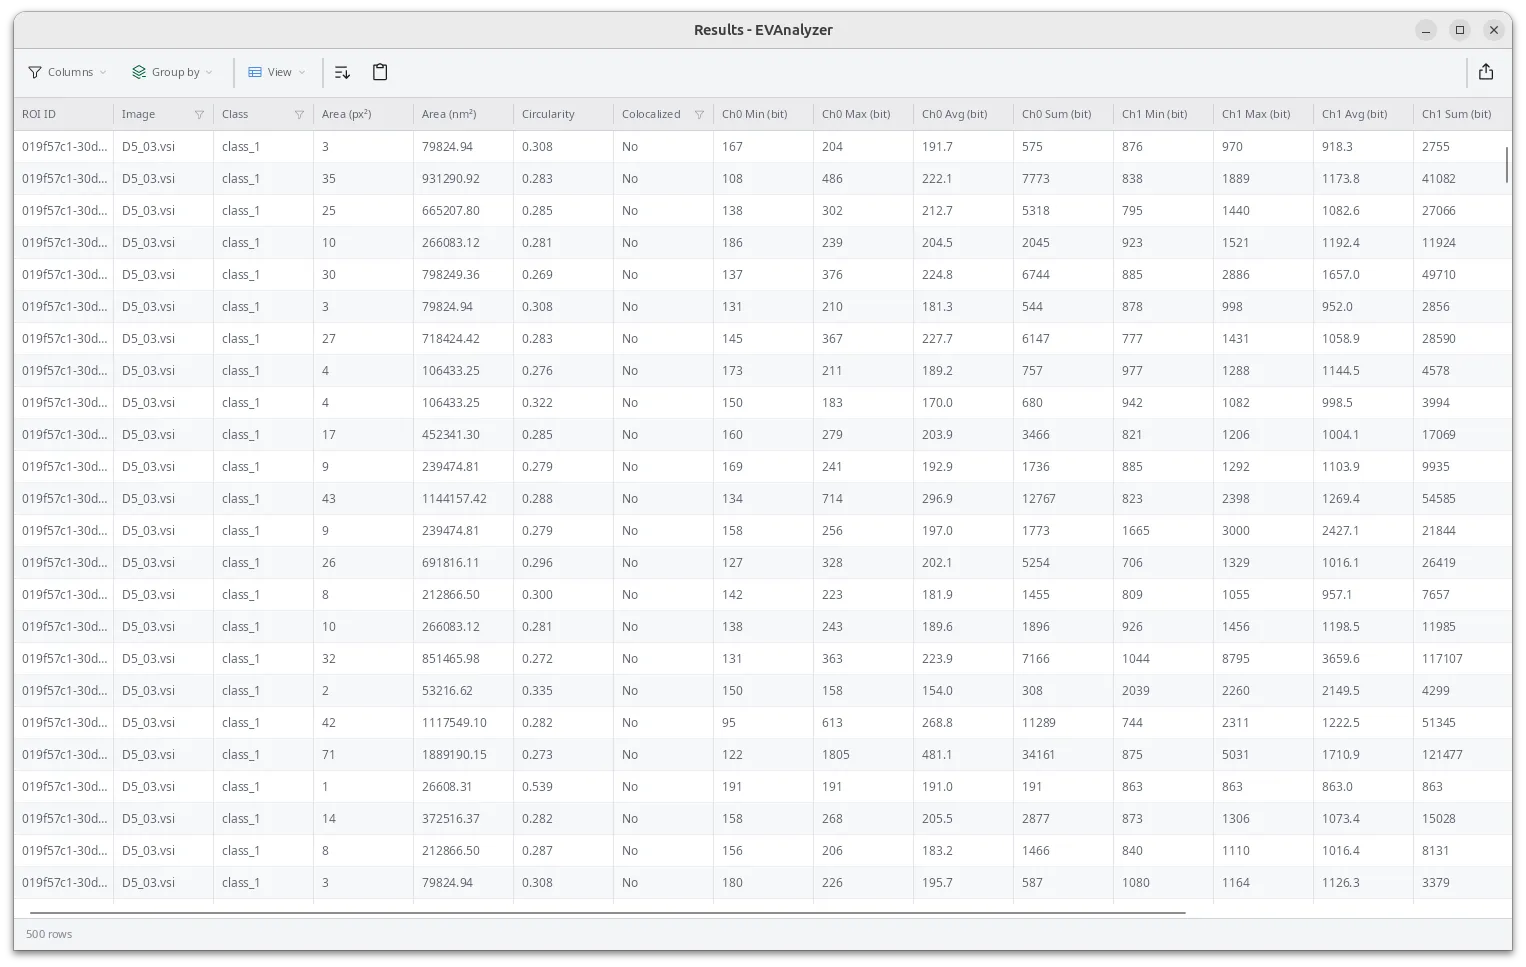
See the Results guide for full details.